
That’s why we helped build a first-of-its-kind wildfire technology framework. In partnership with Smart Electric Power Alliance (SEPA), Overstory, Pano AI, Rhizome, and Technosylva, we contributed to publish the Wildfire Technology Landscape: A Framework for U.S. Utilities.
One Framework. Every Stage.
The report introduces a Six-Stage Wildfire Risk Reduction Framework that maps the full lifecycle of utility wildfire management, from long-range capital planning all the way through post-event recovery and learning.
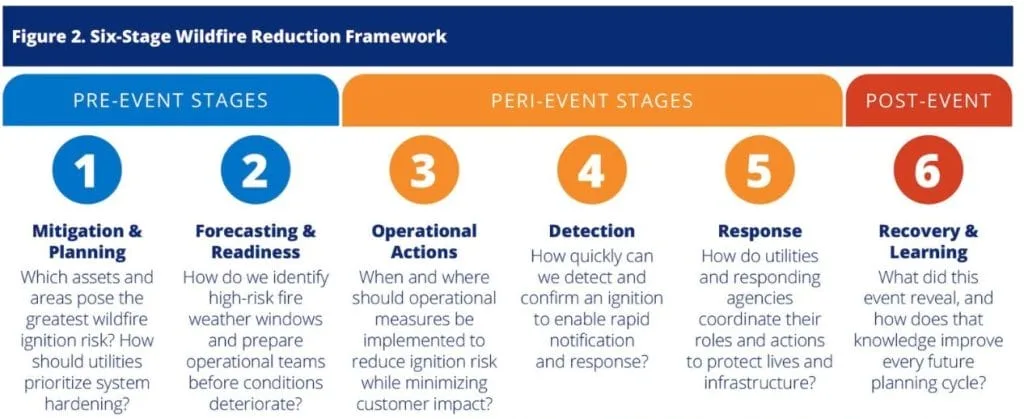
Source: SEPA / PNNL (2026)
Wildfire risk management doesn’t happen in silos, but utility technology stacks often do. What makes this framework valuable is that it reflects how decisions actually flow across an organization. Risk intelligence from pre-season planning informs operational thresholds during high-risk weather windows. Detection alerts feed real-time fire spread simulations. Post-event data retrains ignition probability models and updates capital priorities before the next cycle begins. The framework makes those handoffs clear, because the value of any single technology is multiplied when the data it produces reaches the right team at the right time.
Where eSmart Systems Fits In
Our role sits at the foundation. eSmart Systems analyzes drone, aerial, and ground imagery using AI to assign each asset component-level ignition risk score based on actual component condition, not just age. That data replaces outdated age-based guesswork that has historically driven capital decisions and replaces them with something defensible: real evidence at the asset level.
We also correct GPS coordinate errors in utility GIS records, surface gaps in asset data, and bring asset condition, detection coverage, and vegetation risk together in a single operational dashboard. We operate across all six stages, because good asset intelligence is relevant before, during, and after a wildfire event.
The Policy Picture Is Moving Fast
The regulatory landscape is accelerating alongside the technology. As of May 2026, thirteen states require utilities to file Wildfire Mitigation Plans, and more are watching closely.
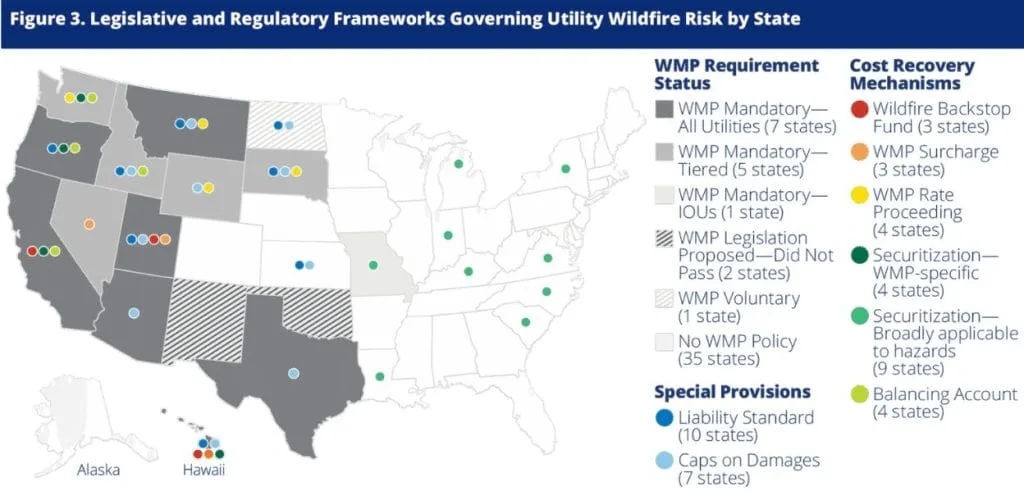
Source: NARUC / PNNL / SEPA (2026)
Whether your state requires a formal WMP or not, the planning frameworks, investment justification tools, and performance metrics in this report give utilities a practical foundation to build from now. Waiting for a mandate is a strategy, but it’s rarely the most cost-effective one.
The Takeaway
The report’s core finding is simple but important: individual technologies deliver value, but the greatest impact comes from connecting them into a unified operational picture. Utilities that do this well reduce ignition risk, make better operational decisions, and build the evidentiary record they need with regulators, insurers, and their boards.
We’re building toward that future with every inspection, every corrected data record, and every integrated dashboard we put in front of a utility team.
Full framework report: DOWNLOAD HERE
Utilities have long understood that no single threat defines resilience. Wildfire, wind, ice, flooding, heat, and even routine conductor fatigue all share a common truth: the grid’s performance during extreme events often hinges on the smallest components. Cotter pins, C-hooks, splices, connectors, insulators, shackles, and other pieces of “minor” hardware have an outsized influence on ignition potential, mechanical integrity, and outage risk – particularly when hazards are escalating faster than traditional inspection cycles can keep up.
Recent wildfire and storm investigations show that catastrophic failures frequently originate not from core grid equipment but rather from the fasteners, attachments, clearances, and conductor interfaces designed to keep assets stable under stress. When one of these components loosens, corrodes, cracks, or is installed incorrectly, the result can create risks that scale quickly under extreme weather or high-fire conditions. This isn’t speculative; stats are well documented, with 10% of California wildfires ignited by utility assets, and nationally known utility-caused fires burning 104,000-390,000 acres annually.
At the same time, hazards themselves are intensifying. Pacific Northwest National Labs (PNNL) notes wildfire exposure is expanding geographically and seasonally, with longer durations of high-risk weather and increased fire potential even in regions that historically saw little wildfire activity. Meanwhile, climate-driven heat, severe storms, and changing wind patterns are stressing transmission and distribution assets outside traditional high-risk prone areas. Extreme weather caused $131B in global losses in the first half of 2025 alone, and customers experiencing an average of 18.2 hours of outages in the Southeast US.
If resilience is the ability to withstand, adapt to, and recover from extreme conditions, then the foundation of resilience is understanding, at a granular level, which components are most likely to fail when conditions are at their worst.
A Lifecycle Framework for All-Hazards Resilience
Utilities increasingly anchor their resilience plans around a lifecycle model that spans Pre-Event, Peri-Event, and Post-Event phases. This approach maps directly to how utilities plan, operate, and restore, and aligns with the “Triple Line of Defense” model highlighted in PNNL’s wildfire and resilience best-practices work.
Figure 1 — Triple Line of Defense
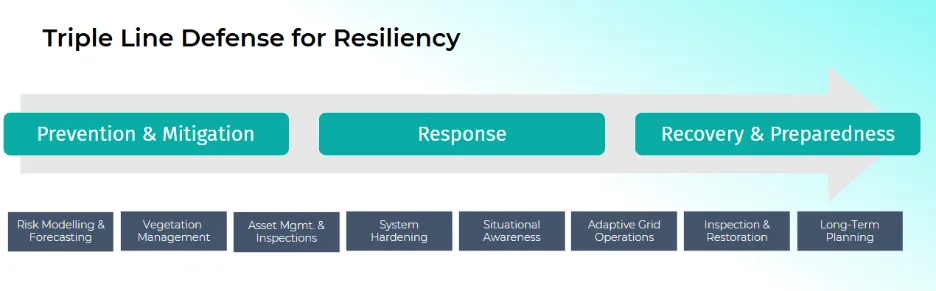
Each phase is driven by different engineering questions:
- Pre-Event: Which segments, assets and components are approaching critical condition?
- Peri-Event: Which structures or spans are most vulnerable under today’s weather?
- Post-Event: What failed, where, and why — and how do we rebuild stronger?
Critically, each phase depends on trusted asset condition intelligence, especially at the component level.
Why Component-Level Inspections Are Foundational to Resilience
1. Turn hazard modeling into actionable engineering risk
Risk emerges from the interaction of hazard and asset vulnerability. Wildfire and extreme-weather risk forecasting improves when combined with reliable, current component condition data. This makes long-duration hazard events more predictable in terms of likely failure points.
2. Support targeted, defensible investment
Patchwork mitigation rarely delivers sustained improvement without common frameworks and measurable risk reduction. Component-level inspection data, as part of a triple line of defense approach, provides exactly that:
- directing hardening where degraded hardware and environmental hazards intersect,
- targeting vegetation management to spans with combined condition and encroachment risk, and
- sequencing capital projects based on failure-mode likelihood rather than geography alone.
3. Enable precision operations during elevated threat windows
Peri-event operations (such as switching, fast-trip settings, sectionalization boundaries, and PSPS alternatives) depend on knowing which assets are least likely to withstand the day’s wind, heat, or lightning. Operators armed with the knowledge of certain hardware configurations or degraded fittings that historically fail under high-wind loading, can more precisely tailor protective schemes.
4. Accelerate post-event restoration and long-term improvement
Accurate pre-event condition data allows utilities to triage restoration based on known vulnerabilities. Post-event, high-resolution component imagery supports root-cause analysis, enabling utilities to refine engineering standards and mitigate recurring failure modes.
When Conditions, Components, and Consequences Align
A Mountain West utility sought to modernize its inspection workflow to address rising wildfire exposure and strong seasonal wind events. However, the driving problem wasn’t a lack of findings, but rather prioritization. Using Grid Vision® to bring inspection observations, component classifications, and environmental context into a single risk-ranking approach so that defects could be evaluated not only by what was wrong, but by how likely it was to fail and how severe the consequence would be if it did. In practice, this meant scoring findings across three dimensions:
- Condition risk – loose, upside‑down, corroded, cracked, contaminated, or missing elements
- Component type and failure-mode risk – with particular attention to cotter pins, C‑hooks, chain shackles, splices and connectors, insulators, and conductor hardware such as armor rods, dampers, and attachment fittings
- Location/environment risk – wind corridors, dense vegetation, steep or inaccessible terrain, elevated fire-weather zones, and wildland–urban interface adjacencies.
Figure 2 – Aerial View of Lattice Tower and Zoom of Upside-Down Cotter Pin Detected by AI
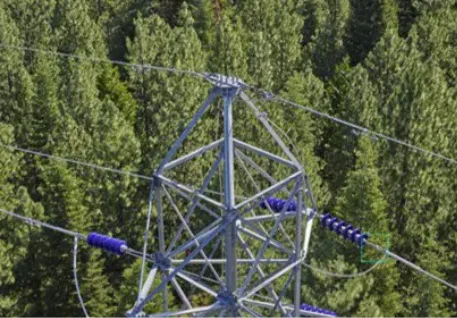
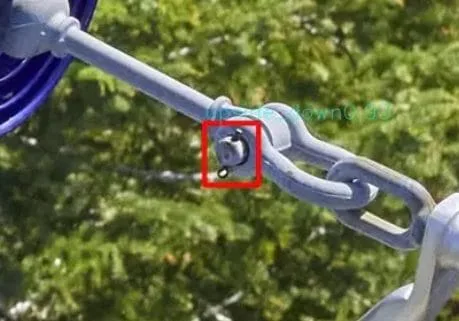
When the results were analyzed, the utility discovered that about 7% of observed cotter pins were installed upside‑down, alongside other recurring issues like worn shackles and compromised insulators. Conditions that can materially increase the likelihood of conductor movement, arcing/flashover, or mechanical failure under high-wind and high-fire-risk conditions.
Importantly, the highest-risk findings were not evenly distributed; they clustered in wind-exposed corridors, tight drainages, and other high-consequence segments, enabling the utility to produce a focused work plan that directed maintenance and hardening resources to the places where component degradation and environmental hazard intersected most acutely. The shift was simple but significant: away from “fix everything” and toward “fix what matters most.”
How Component-Level Intelligence Enables the Full Resilience Flow
Component-level grid intelligence is most valuable when it doesn’t live in a silo. When inspection findings are consistently attributed to specific assets and component types, they become the connective tissue that links resilience planning, operations, and restoration into a single, closed loop.
Pre-event, component condition data strengthens risk modeling and forecasting by grounding hazard exposure in real asset vulnerability. It also sharpens capital and maintenance prioritization – helping utilities target hardening programs and vegetation work where degraded hardware and high-consequence environments overlap.
Peri-event, operators can pair real-time weather and situational awareness with known component vulnerabilities to apply more precise operational strategies. Instead of treating the system uniformly under elevated threat, utilities can focus settings, switching, and field response around the assets most likely to fail under the conditions that day.
Post-event, a high-fidelity inspection history accelerates triage and restoration by helping crews distinguish between legacy defects and event-driven damage. That same structured record supports defensible documentation, both for internal engineering review and for the reporting and learning cycles that drive better outcomes in the next season.
Over time, this intelligence feeds long-term planning by revealing recurring failure modes across component families and environments. This enables utilities to refine specifications, adjust standards, and sequence capital work around measured risk reduction rather than time-based / cyclical actions.
Most importantly, it enables continuous improvement. Sustained progress on catastrophic risk challenges requires common measures and repeatable frameworks. Component-level data provides the baseline for those measures by making risk visible, comparable, and improvable year over year.
Put simply: this “data thread” is what transforms inspections from a periodic compliance activity into the backbone of a triple line of defense resilience model. It links risk to action, action to outcomes, and outcomes back to better decisions.
Where Resilience Becomes Real
Extreme weather and wildfire will be critical in shaping utility performance (and public trust) for the next decade. The industry will of course continue to invest in hardening, automation, and vegetation programs, as those investments remain essential. But field experience keeps reinforcing a less glamorous truth: resilience often comes down to whether the smallest pieces of hardware (across the existing hundreds of thousands of miles of lines) are going to be able to do their job when conditions are at their worst.
Cotter pins, splices, connectors, insulators, shackles, and other “minor” components can be the difference between a routine disturbance and a cascading event. Between a momentary fault and a serious event. When those components are visible, measurable, and prioritized in context (condition plus component type plus environment) utilities can shift from broadly “doing more” to surgically optimizing investment towards what matters most.
That’s what component-level inspection intelligence enables across the full resilience lifecycle: smarter pre-event prioritization, more precise peri-event operations, and faster, better-informed post-event recovery. And that’s the real shift underway: a resilience operating model utilities can defend, scale, and continuously improve.
This article was originally published on T&D World on Feb. 25, 2026 – https://www.tdworld.com/reliability-and-resiliency/article/55359830/small-components-big-consequences-how-component-level-insights-reduce-catastrophic-grid-risks

The energy landscape has entered a volatile era of climate disruption. Regions once considered safe now face the devastating reality of escalating wildfires and extreme weather. In this episode of the Factor this Podcast, host Jeremiah Karpowicz sits down with Don McPhail, VP of Market Development at eSmart Systems, to discuss why traditional, asset-focused mitigation is no longer enough for utilities across the United States.
We explore the critical shift to community-first resilience models, where protecting life-sustaining infrastructure takes priority over mere compliance. How exactly are digitization and AI-powered digital twins transforming grid safety? What does it mean to use high-resolution imagery to identify minute defects like upside-down cotter pins in a way that creates quantifiable value? Don provides a roadmap for utility leaders ready to trade siloed data practices for predictive insights that save time, money, and lives.
Listen to it on the Factor This Podcast, or on Spotify and Apple Podcasts:
The energy landscape has entered a volatile era of climate disruption. Regions once considered safe now face the devastating reality of escalating wildfires and extreme weather. In this episode of the Factor this Podcast, host Jeremiah Karpowicz sits down with Don McPhail, VP of Market Development at eSmart Systems, to discuss why traditional, asset-focused mitigation is no longer enough for utilities across the United States.
We explore the critical shift to community-first resilience models, where protecting life-sustaining infrastructure takes priority over mere compliance. How exactly are digitization and AI-powered digital twins transforming grid safety? What does it mean to use high-resolution imagery to identify minute defects like upside-down cotter pins in a way that creates quantifiable value? Don provides a roadmap for utility leaders ready to trade siloed data practices for predictive insights that save time, money, and lives.
Listen to it on the Factor This Podcast, or on Spotify and Apple Podcasts: